# Basics
import numpy as np
import pandas as pd
import matplotlib.pyplot as plt
import seaborn as sns

# Machine Learning
from sklearn.datasets import make_regression
from sklearn.datasets import make_classification
from sklearn.model_selection import train_test_split, GridSearchCV
from sklearn.preprocessing import StandardScaler
from sklearn.pipeline import Pipeline
from sklearn.neighbors import KNeighborsClassifier
from sklearn.tree import DecisionTreeClassifier
from sklearn.tree import plot_tree

# Data
from palmerpenguins import load_penguinsCS 307: Week 08
# Suppress warnings from seaborn with "new" versions of pandas
import warnings
warnings.simplefilter(action="ignore", category=FutureWarning)
warnings.simplefilter(action="ignore", category=UserWarning)
Simulated Data
# Simulate a regression dataset and inspect the target variable
X, y = make_regression(n_samples=10, n_features=2, random_state=42)
print(y)
print(y.dtype)
[ 149.12377331 -21.51824216 -122.81779 -57.70307069 21.18919281
-152.30294423 11.79746103 132.28028651 -139.19099261 -29.06290362]
float64# Simulate a train and test classification datasets and inspect the target variable
X_train, y_train = make_classification(n_samples=200, n_features=2, n_informative=2, n_redundant=0, random_state=42)
X_test, y_test = make_classification(n_samples=100, n_features=2, n_informative=2, n_redundant=0, random_state=1)
print(y_train)
print(y_train.dtype)[1 1 0 0 1 1 0 0 0 0 1 1 0 1 1 0 1 1 0 1 0 0 0 1 0 1 1 0 1 1 1 0 0 0 0 1 0
1 0 1 0 1 0 0 0 0 0 0 1 1 1 1 1 1 0 1 0 1 1 0 1 0 0 0 0 1 0 0 1 1 1 0 1 0
1 0 0 0 0 0 1 1 0 1 0 0 0 0 1 1 0 1 1 0 1 1 0 1 0 1 0 1 1 1 0 0 0 0 1 0 0
0 1 0 0 1 0 1 1 0 0 1 0 0 1 0 0 1 1 1 1 0 1 0 0 0 1 1 1 1 1 1 1 0 1 0 0 0
0 0 1 0 1 1 1 1 0 1 1 0 0 1 0 1 0 1 1 0 0 0 1 1 1 1 1 0 1 1 1 0 1 0 0 0 1
0 1 0 1 0 1 1 0 1 1 0 1 0 1 0]
int64# Create a (temporary) dataframe with the data
df = pd.DataFrame(X_train, columns=['Feature 1', 'Feature 2'])
df['Class'] = y_train
# Create the pairs plot
sns.pairplot(df, hue='Class');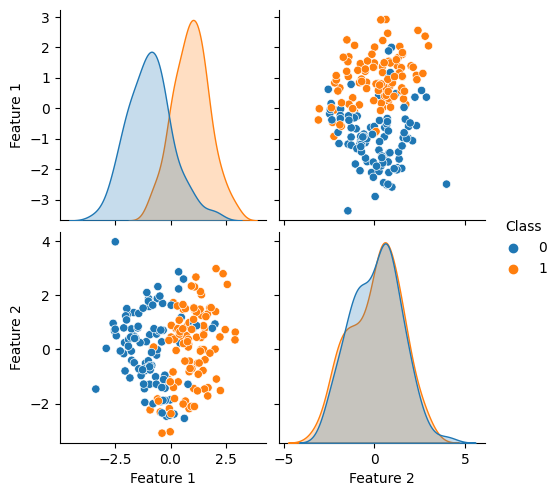
# Create a KNN classifier
knn = KNeighborsClassifier(n_neighbors=11, algorithm="brute")
# Create a decision tree classifier
dt = DecisionTreeClassifier(min_samples_split=25, random_state=42)# Fit the KNN classifier to the train data
knn.fit(X_train, y_train)KNeighborsClassifier(algorithm='brute', n_neighbors=11)In a Jupyter environment, please rerun this cell to show the HTML representation or trust the notebook.
On GitHub, the HTML representation is unable to render, please try loading this page with nbviewer.org.
KNeighborsClassifier(algorithm='brute', n_neighbors=11)
# Fit the decision classifier to the train data
dt.fit(X_train, y_train)
DecisionTreeClassifier(min_samples_split=25, random_state=42)In a Jupyter environment, please rerun this cell to show the HTML representation or trust the notebook.
On GitHub, the HTML representation is unable to render, please try loading this page with nbviewer.org.
DecisionTreeClassifier(min_samples_split=25, random_state=42)
# Get estimated conditional probabilities for each test observation
knn.predict_proba(X_test)
array([[0. , 1. ],
[0. , 1. ],
[0.90909091, 0.09090909],
[0.81818182, 0.18181818],
[0.81818182, 0.18181818],
[0.36363636, 0.63636364],
[0.09090909, 0.90909091],
[0. , 1. ],
[1. , 0. ],
[0.45454545, 0.54545455],
[1. , 0. ],
[0.90909091, 0.09090909],
[0.27272727, 0.72727273],
[1. , 0. ],
[1. , 0. ],
[0.36363636, 0.63636364],
[0.63636364, 0.36363636],
[0.09090909, 0.90909091],
[1. , 0. ],
[1. , 0. ],
[1. , 0. ],
[0.90909091, 0.09090909],
[0.81818182, 0.18181818],
[0.09090909, 0.90909091],
[0.81818182, 0.18181818],
[1. , 0. ],
[0.81818182, 0.18181818],
[0.90909091, 0.09090909],
[1. , 0. ],
[0.81818182, 0.18181818],
[0.09090909, 0.90909091],
[1. , 0. ],
[1. , 0. ],
[0.27272727, 0.72727273],
[0.90909091, 0.09090909],
[1. , 0. ],
[1. , 0. ],
[1. , 0. ],
[0.09090909, 0.90909091],
[0.09090909, 0.90909091],
[0.27272727, 0.72727273],
[1. , 0. ],
[0.72727273, 0.27272727],
[0. , 1. ],
[0. , 1. ],
[0.09090909, 0.90909091],
[1. , 0. ],
[0. , 1. ],
[1. , 0. ],
[0.27272727, 0.72727273],
[0.90909091, 0.09090909],
[1. , 0. ],
[0.09090909, 0.90909091],
[1. , 0. ],
[1. , 0. ],
[0.81818182, 0.18181818],
[0.72727273, 0.27272727],
[0.09090909, 0.90909091],
[0.09090909, 0.90909091],
[0.18181818, 0.81818182],
[0.09090909, 0.90909091],
[1. , 0. ],
[0.09090909, 0.90909091],
[0.09090909, 0.90909091],
[1. , 0. ],
[0.18181818, 0.81818182],
[0.27272727, 0.72727273],
[0.27272727, 0.72727273],
[0.81818182, 0.18181818],
[1. , 0. ],
[1. , 0. ],
[1. , 0. ],
[0.09090909, 0.90909091],
[0.09090909, 0.90909091],
[0.09090909, 0.90909091],
[0.09090909, 0.90909091],
[1. , 0. ],
[0.81818182, 0.18181818],
[0.18181818, 0.81818182],
[0.09090909, 0.90909091],
[0.09090909, 0.90909091],
[0.09090909, 0.90909091],
[1. , 0. ],
[0.18181818, 0.81818182],
[0.09090909, 0.90909091],
[0.81818182, 0.18181818],
[0.09090909, 0.90909091],
[0.27272727, 0.72727273],
[0. , 1. ],
[1. , 0. ],
[1. , 0. ],
[0.09090909, 0.90909091],
[0. , 1. ],
[0.81818182, 0.18181818],
[0. , 1. ],
[0.09090909, 0.90909091],
[1. , 0. ],
[1. , 0. ],
[0.09090909, 0.90909091],
[1. , 0. ]])# Make classifications for the test data
knn.predict(X_train)array([1, 1, 0, 0, 1, 1, 0, 0, 0, 1, 1, 1, 0, 0, 1, 1, 0, 1, 0, 1, 0, 0,
0, 1, 0, 1, 1, 0, 0, 1, 1, 0, 0, 0, 0, 1, 1, 0, 0, 1, 0, 1, 0, 0,
0, 0, 0, 0, 1, 1, 1, 1, 1, 1, 0, 1, 0, 1, 1, 1, 1, 0, 0, 0, 0, 1,
0, 0, 1, 1, 1, 0, 1, 0, 1, 0, 0, 0, 0, 0, 1, 1, 0, 1, 0, 0, 0, 0,
1, 1, 1, 1, 1, 0, 1, 1, 0, 1, 0, 1, 0, 1, 1, 1, 0, 1, 0, 0, 1, 0,
0, 0, 1, 0, 0, 1, 0, 0, 1, 0, 0, 1, 0, 0, 0, 0, 0, 1, 1, 1, 1, 0,
1, 1, 0, 0, 1, 1, 1, 0, 1, 1, 1, 0, 1, 0, 0, 0, 0, 0, 0, 0, 1, 1,
1, 1, 1, 1, 1, 0, 0, 1, 0, 1, 1, 1, 1, 0, 0, 0, 0, 0, 1, 1, 1, 1,
1, 1, 1, 0, 1, 1, 0, 0, 1, 0, 1, 1, 1, 0, 1, 1, 0, 1, 1, 0, 1, 1,
1, 0])# Get estimated conditional probabilities for each test observation
dt.predict_proba(X_test)array([[0. , 1. ],
[0. , 1. ],
[1. , 0. ],
[0.90909091, 0.09090909],
[1. , 0. ],
[0.5 , 0.5 ],
[0. , 1. ],
[0. , 1. ],
[1. , 0. ],
[0.45454545, 0.54545455],
[1. , 0. ],
[0.90909091, 0.09090909],
[0. , 1. ],
[1. , 0. ],
[0.90909091, 0.09090909],
[0. , 1. ],
[0.90909091, 0.09090909],
[0.04347826, 0.95652174],
[0.90909091, 0.09090909],
[1. , 0. ],
[1. , 0. ],
[0.90909091, 0.09090909],
[1. , 0. ],
[0. , 1. ],
[1. , 0. ],
[0.90909091, 0.09090909],
[1. , 0. ],
[0.90909091, 0.09090909],
[1. , 0. ],
[1. , 0. ],
[0. , 1. ],
[1. , 0. ],
[1. , 0. ],
[0.45454545, 0.54545455],
[0.90909091, 0.09090909],
[1. , 0. ],
[1. , 0. ],
[1. , 0. ],
[0. , 1. ],
[0. , 1. ],
[0. , 1. ],
[1. , 0. ],
[0.58333333, 0.41666667],
[0. , 1. ],
[0. , 1. ],
[0.04347826, 0.95652174],
[1. , 0. ],
[0. , 1. ],
[1. , 0. ],
[0.04347826, 0.95652174],
[0.90909091, 0.09090909],
[1. , 0. ],
[0.04347826, 0.95652174],
[1. , 0. ],
[1. , 0. ],
[0.90909091, 0.09090909],
[0.58333333, 0.41666667],
[0.04347826, 0.95652174],
[0. , 1. ],
[0. , 1. ],
[0.04347826, 0.95652174],
[1. , 0. ],
[0.04347826, 0.95652174],
[0. , 1. ],
[1. , 0. ],
[0.45454545, 0.54545455],
[0. , 1. ],
[0. , 1. ],
[1. , 0. ],
[1. , 0. ],
[1. , 0. ],
[1. , 0. ],
[0. , 1. ],
[0. , 1. ],
[0.04347826, 0.95652174],
[0. , 1. ],
[1. , 0. ],
[0.90909091, 0.09090909],
[0. , 1. ],
[0.04347826, 0.95652174],
[0. , 1. ],
[0. , 1. ],
[0.90909091, 0.09090909],
[0. , 1. ],
[0.04347826, 0.95652174],
[0.58333333, 0.41666667],
[0.04347826, 0.95652174],
[0.5 , 0.5 ],
[0. , 1. ],
[1. , 0. ],
[1. , 0. ],
[0.04347826, 0.95652174],
[0. , 1. ],
[0.90909091, 0.09090909],
[0. , 1. ],
[0. , 1. ],
[1. , 0. ],
[1. , 0. ],
[0. , 1. ],
[1. , 0. ]])# Make classifications for the test data
dt.predict(X_test)array([1, 1, 0, 0, 0, 0, 1, 1, 0, 1, 0, 0, 1, 0, 0, 1, 0, 1, 0, 0, 0, 0,
0, 1, 0, 0, 0, 0, 0, 0, 1, 0, 0, 1, 0, 0, 0, 0, 1, 1, 1, 0, 0, 1,
1, 1, 0, 1, 0, 1, 0, 0, 1, 0, 0, 0, 0, 1, 1, 1, 1, 0, 1, 1, 0, 1,
1, 1, 0, 0, 0, 0, 1, 1, 1, 1, 0, 0, 1, 1, 1, 1, 0, 1, 1, 0, 1, 0,
1, 0, 0, 1, 1, 0, 1, 1, 0, 0, 1, 0])# Plot the decision tree
plt.figure(figsize=(20, 10))
plot_tree(dt, filled=True, proportion=True)
plt.show()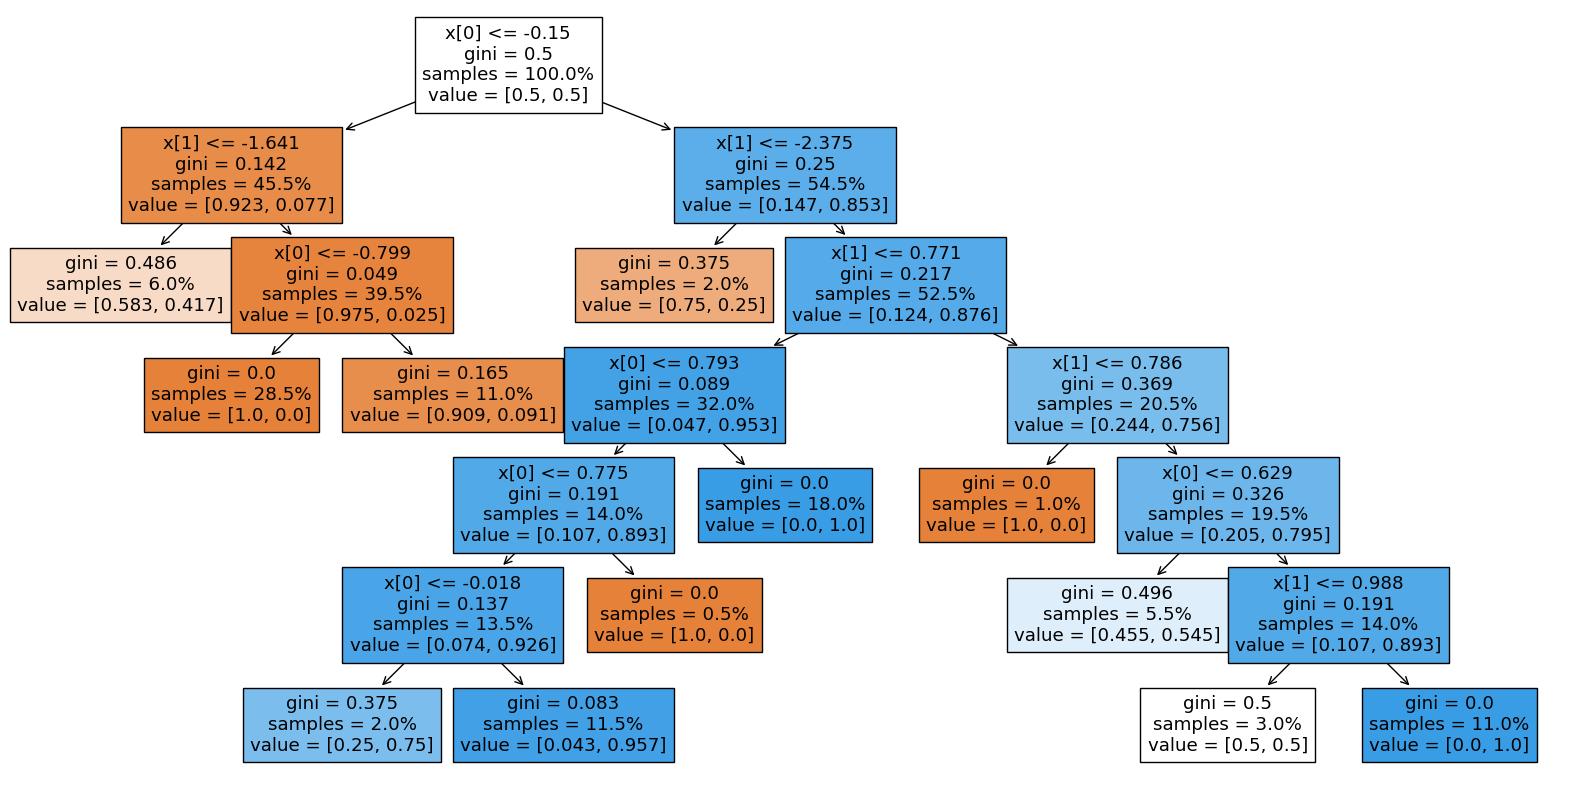
Palmer Penguins
# Load the dataset
penguins = load_penguins()

# Create a pairs plot
sns.pairplot(penguins, hue='species', palette="muted");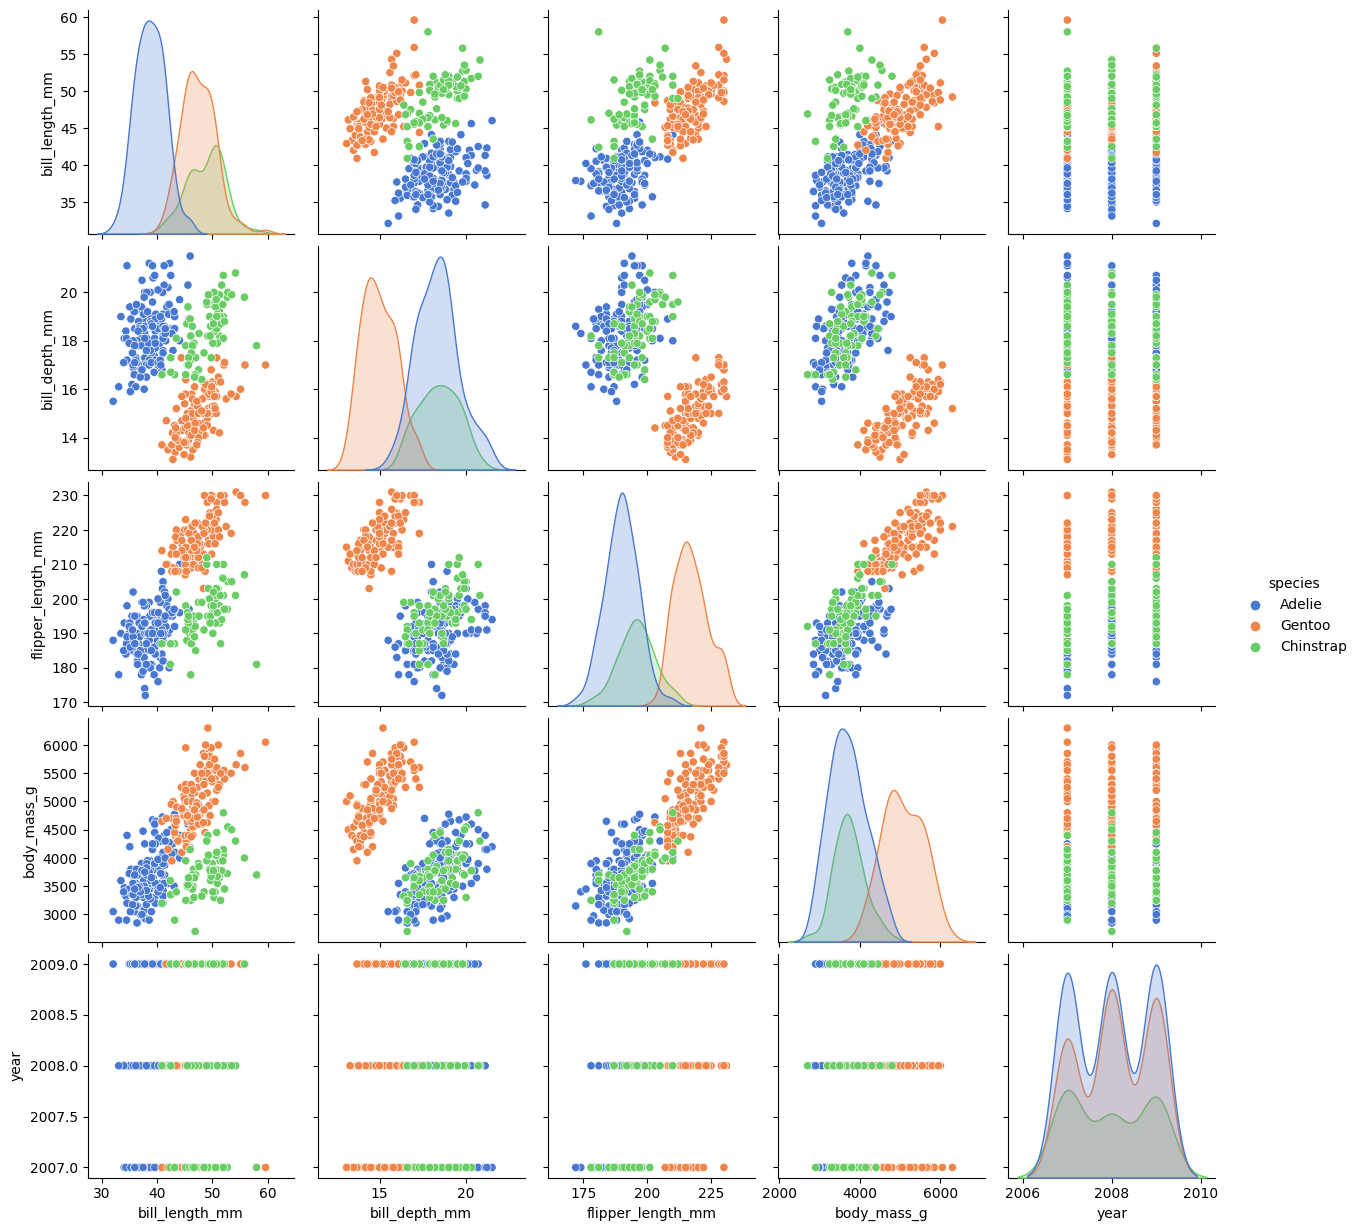
# View the data frame
penguins| species | island | bill_length_mm | bill_depth_mm | flipper_length_mm | body_mass_g | sex | year | |
|---|---|---|---|---|---|---|---|---|
| 0 | Adelie | Torgersen | 39.1 | 18.7 | 181.0 | 3750.0 | male | 2007 |
| 1 | Adelie | Torgersen | 39.5 | 17.4 | 186.0 | 3800.0 | female | 2007 |
| 2 | Adelie | Torgersen | 40.3 | 18.0 | 195.0 | 3250.0 | female | 2007 |
| 3 | Adelie | Torgersen | NaN | NaN | NaN | NaN | NaN | 2007 |
| 4 | Adelie | Torgersen | 36.7 | 19.3 | 193.0 | 3450.0 | female | 2007 |
| ... | ... | ... | ... | ... | ... | ... | ... | ... |
| 339 | Chinstrap | Dream | 55.8 | 19.8 | 207.0 | 4000.0 | male | 2009 |
| 340 | Chinstrap | Dream | 43.5 | 18.1 | 202.0 | 3400.0 | female | 2009 |
| 341 | Chinstrap | Dream | 49.6 | 18.2 | 193.0 | 3775.0 | male | 2009 |
| 342 | Chinstrap | Dream | 50.8 | 19.0 | 210.0 | 4100.0 | male | 2009 |
| 343 | Chinstrap | Dream | 50.2 | 18.7 | 198.0 | 3775.0 | female | 2009 |
344 rows × 8 columns
# Load the dataset
X, y = load_penguins(return_X_y=True, drop_na=True)

# Convert y to category
y = y.astype('category')

# Split the dataset into train and test sets
X_train, X_test, y_train, y_test = train_test_split(X, y, test_size=0.2, random_state=42)
# View the X_train data frame
X_train| bill_length_mm | bill_depth_mm | flipper_length_mm | body_mass_g | |
|---|---|---|---|---|
| 232 | 49.1 | 14.5 | 212.0 | 4625.0 |
| 84 | 37.3 | 17.8 | 191.0 | 3350.0 |
| 306 | 40.9 | 16.6 | 187.0 | 3200.0 |
| 22 | 35.9 | 19.2 | 189.0 | 3800.0 |
| 29 | 40.5 | 18.9 | 180.0 | 3950.0 |
| ... | ... | ... | ... | ... |
| 195 | 49.6 | 15.0 | 216.0 | 4750.0 |
| 77 | 37.2 | 19.4 | 184.0 | 3900.0 |
| 112 | 39.7 | 17.7 | 193.0 | 3200.0 |
| 281 | 45.2 | 17.8 | 198.0 | 3950.0 |
| 108 | 38.1 | 17.0 | 181.0 | 3175.0 |
266 rows × 4 columns
# View the y_train series
y_train
232 Gentoo
84 Adelie
306 Chinstrap
22 Adelie
29 Adelie
...
195 Gentoo
77 Adelie
112 Adelie
281 Chinstrap
108 Adelie
Name: species, Length: 266, dtype: category
Categories (3, object): ['Adelie', 'Chinstrap', 'Gentoo']# Build the pipeline
pipe = Pipeline([
('scaler', StandardScaler()),
('knn', KNeighborsClassifier())
])
# Tune the hyperparameters of the KNN classifier
param_grid = {'knn__n_neighbors': list(range(1, 50, 2))}
knn_grid = GridSearchCV(pipe, param_grid, cv=5)
knn_grid.fit(X_train, y_train)
# Print the best hyperparameters and the accuracy score
print("Best hyperparameters: ", knn_grid.best_params_)
print("Best CV accuracy score: ", knn_grid.best_score_)
print("Test accuracy score: ", knn_grid.score(X_test, y_test))Best hyperparameters: {'knn__n_neighbors': 17}
Best CV accuracy score: 0.9812019566736548
Test accuracy score: 0.9701492537313433# Build the pipeline
pipe = Pipeline([
('scaler', StandardScaler()),
('dt', DecisionTreeClassifier(criterion="entropy", random_state=42))
])
# Tune the hyperparameters of the decision tree classifier
param_grid = {
'dt__max_depth': [3, 5, 7],
'dt__min_samples_split': [2, 5, 10]
}
dt_grid = GridSearchCV(pipe, param_grid, cv=5)
dt_grid.fit(X_train, y_train)
# Print the best hyperparameters and the accuracy score
print("Best hyperparameters: ", dt_grid.best_params_)
print("Best CV accuracy score: ", dt_grid.best_score_)
print("Test accuracy score: ", dt_grid.score(X_test, y_test))Best hyperparameters: {'dt__max_depth': 5, 'dt__min_samples_split': 2}
Best CV accuracy score: 0.9549266247379455
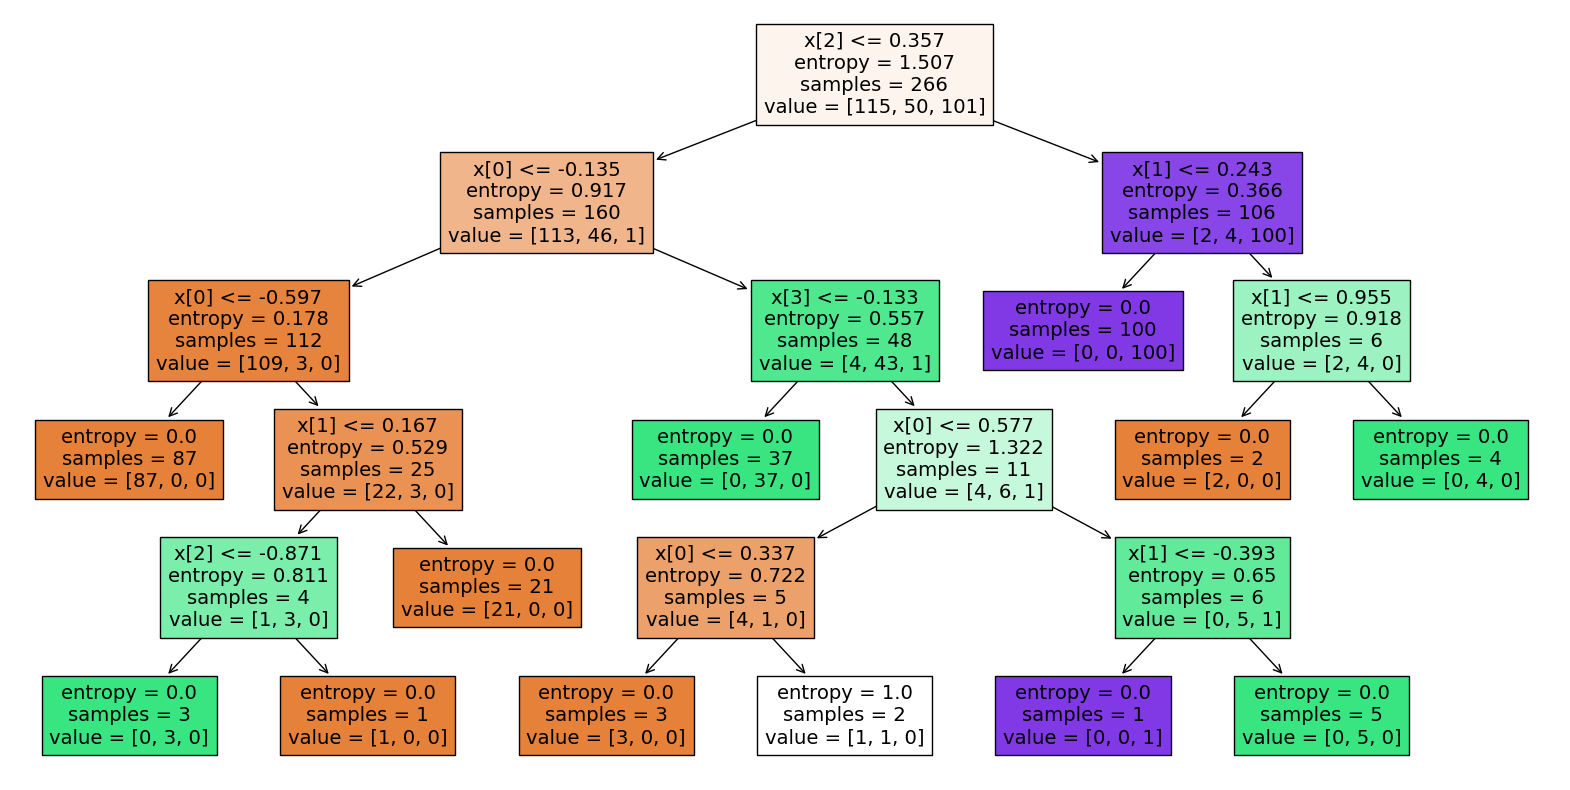
Test accuracy score: 1.0# Plot the decision tree
plt.figure(figsize=(20, 10))
plot_tree(dt_grid.best_estimator_.named_steps['dt'], filled=True)
plt.show()